Climate Change Vulnerability Assessment for the Upper Snake River Watershed
This collaborative vulnerability assessment expressly considered the species, habitats, and resources that are important and valuable to USRT member tribes. Climate change impacts on these resources have the potential to affect tribal members’ culture, spirituality, and lifeways.
The collaboration involved the direct and ongoing participation of USRT staff and the leadership, staff, and membership of the four member tribes. Combining the best available localized climate projections with traditional knowledge, tribal priorities, and local observations were central to the success of this assessment.
This vulnerability assessment included four steps:
- Analyzing downscaled temperature and precipitation projections for the project area;
- Site visits to USRT member tribes’ reservations to identify Shared Concerns;
- Use of the NatureServe Climate Change Vulnerability Index (CCVI) and other methods to determine relative vulnerability rankings; and
- A collaborative vulnerability assessment workshop in Boise with USRT member tribes’ staff and leadership.
USRT Climate Vulnerability Project Summary
USRT Climate Change Vulnerability Assessment (This is a compressed file. Please contact us for the full version.)
USRT Climate Vulnerability Assessment Poster
USRT Riparian Summary Sheet
USRT Mule Deer Climate Summary Sheet
USRT Jackrabbit Climate Summary Sheet
USRT Geyers Williow Climate Summary Sheet
USRT Columbia Spotted Frog Climate Summary Sheet
USRT Chokecherry Climate Summary Sheet
USRT Chinook Salmon Climate Summary Sheet
USRT Big Sagebrush Climate Summary Sheet
Climate Change Projections
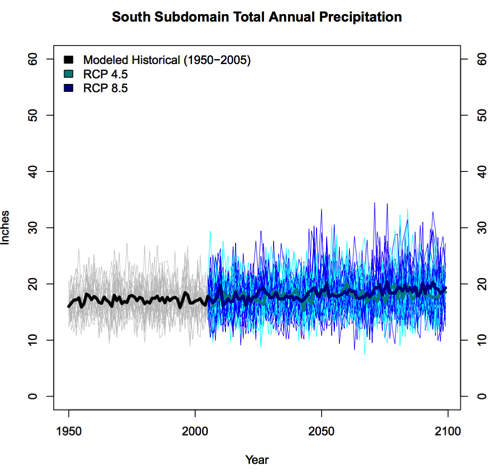
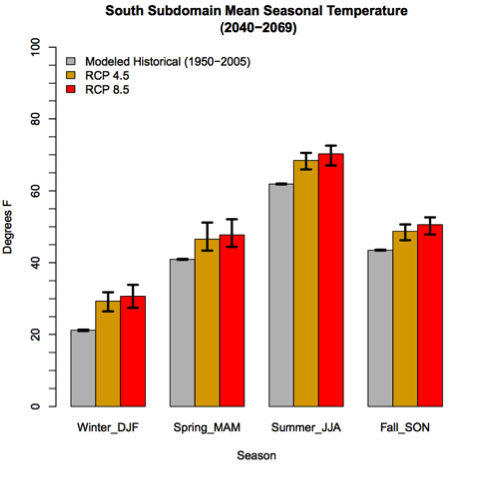
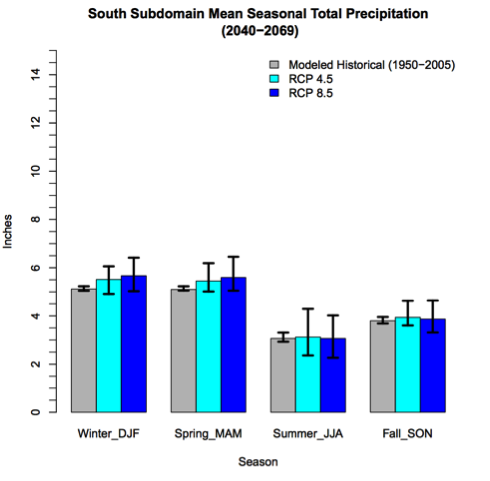
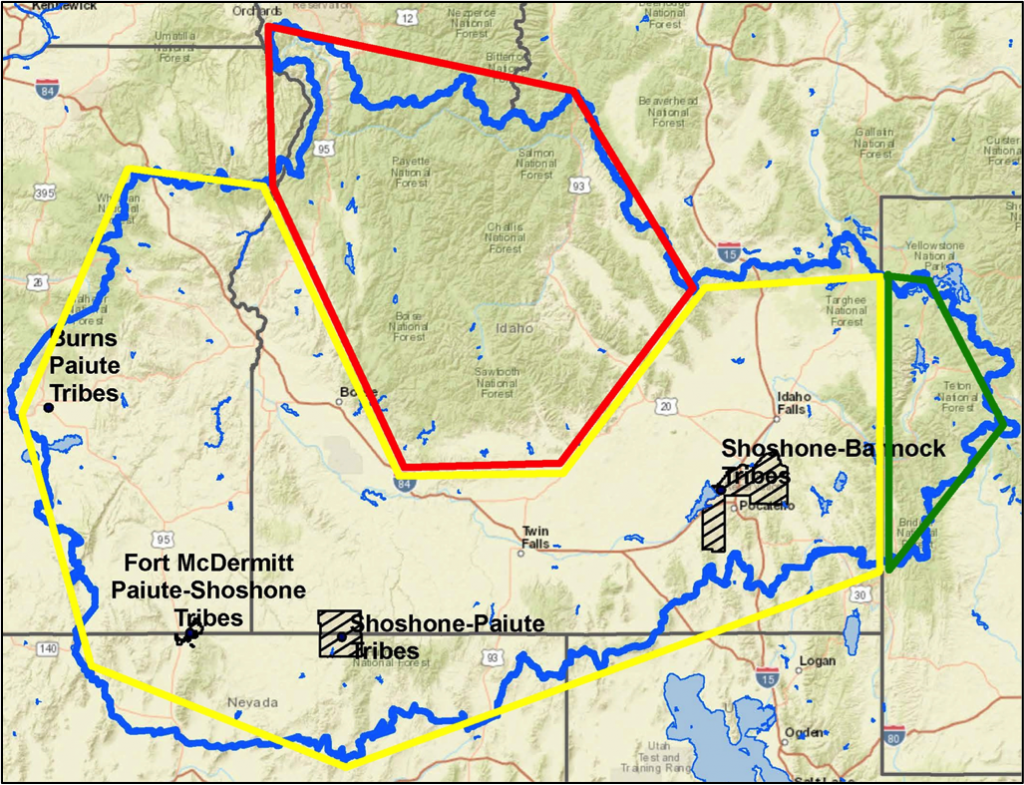
This project used downscaled climate data to generate projections for relevant climate parameters, such as temperature and precipitation. The colored domains in the figure below represent distinct climate zones and are outlined in red, yellow, and green. They blue line represents the Upper Snake River Watershed.
Below are Climate Projections for the YELLOW Domain of the Upper Snake River. Cli-mate variables presented include: average annual temperature (1950-2100), average annual precipitation (1950-2100), mean seasonal temperature (2040-2069), and mean seasonal precipitation (2040-2069). These climate variables are shown in their histori-cal amounts and in future scenarios, including: a greenhouse gas reduction scenario (RCP 4.5) and a “business as usual” greenhouse gas emission scenario (RCP 8.5).